How low can the Bitcoin price go?

Bitcoin is down to one-month lows, and BTC price predictions are tending to assume worse is to come — how much lower can bears manage?
The price of Bitcoin () has fallen to one-month lows, and traders are increasingly betting on more downside to come.
BTC price performance has weakened in recent days, with BTC/USD hitting $28,850 on July 24, data from and confirms.
Despite a brief rebound, market participants remain unconvinced that the largest cryptocurrency has seen the worst of its losses.
Cointelegraph looks at current prognoses for crypto and risk assets during a major macroeconomic week.
 BTC/USD 1-day chart. Source: TradingView
For popular trader Crypto Ed, the prior dip to Bitcoin’s lowest since June 21 was entirely expected.
Now, he believes that a final break into buy liquidity should occur, taking BTC/USD to around $28,500. A relief bounce to $29,400 could come first.
“If we do get a move like this, then I’m looking for a setup for more downside and possibly $28,500 - 400, more or less,” he said in his latest YouTube .
Crypto Ed showed an additional target box covering prices as low as $27,800, but acknowledged that he was unconvinced that Bitcoin would make it there.
For fellow trader Crypto Chase, the downside could take Bitcoin toward $27,000 before last-minute long entries get suitably burned.
Speculators should end up bidding at major price points as BTC/USD moves down — at $29,200, $28,500 and $28,000, he predicted earlier in July.
In an on July 24, he maintained that this was the likely course of events.
“These are still mostly my thoughts. I can’t short now as strong R/R opportunities are behind us, decent entries were not offered based on my strategies,” he acknowledged to Twitter followers.
 BTC/USD annotated chart. Source: Crypto Chase/Twitter
An accompanying chart showed relevant Fibonacci retracement levels for the daily chart.
Ahead of a series of crunch United States macro events, various traders are keeping out of Bitcoin until a more apparent trend emerges.
Related:
Nonetheless, as important lines in the sand, among them the 200-week and 21-week at $27,130 and $28,200, respectively.
“Bitcoin is testing support in a key zone of historical significance,” Keith Alan, co-founder of monitoring resource Material Indicators, on July 24.
 BTC/USD 1-week chart with 21, 200 MAs. Source: TradingView
As Cointelegraph reported, some worst-case scenarios include far deeper drawdowns, with not entirely off the table.
Magazine:
The views, thoughts and opinions expressed here are the authors’ alone and do not necessarily reflect or represent the views and opinions of Cointelegraph.
Disclaimer: The content of this article solely reflects the author's opinion and does not represent the platform in any capacity. This article is not intended to serve as a reference for making investment decisions.
You may also like
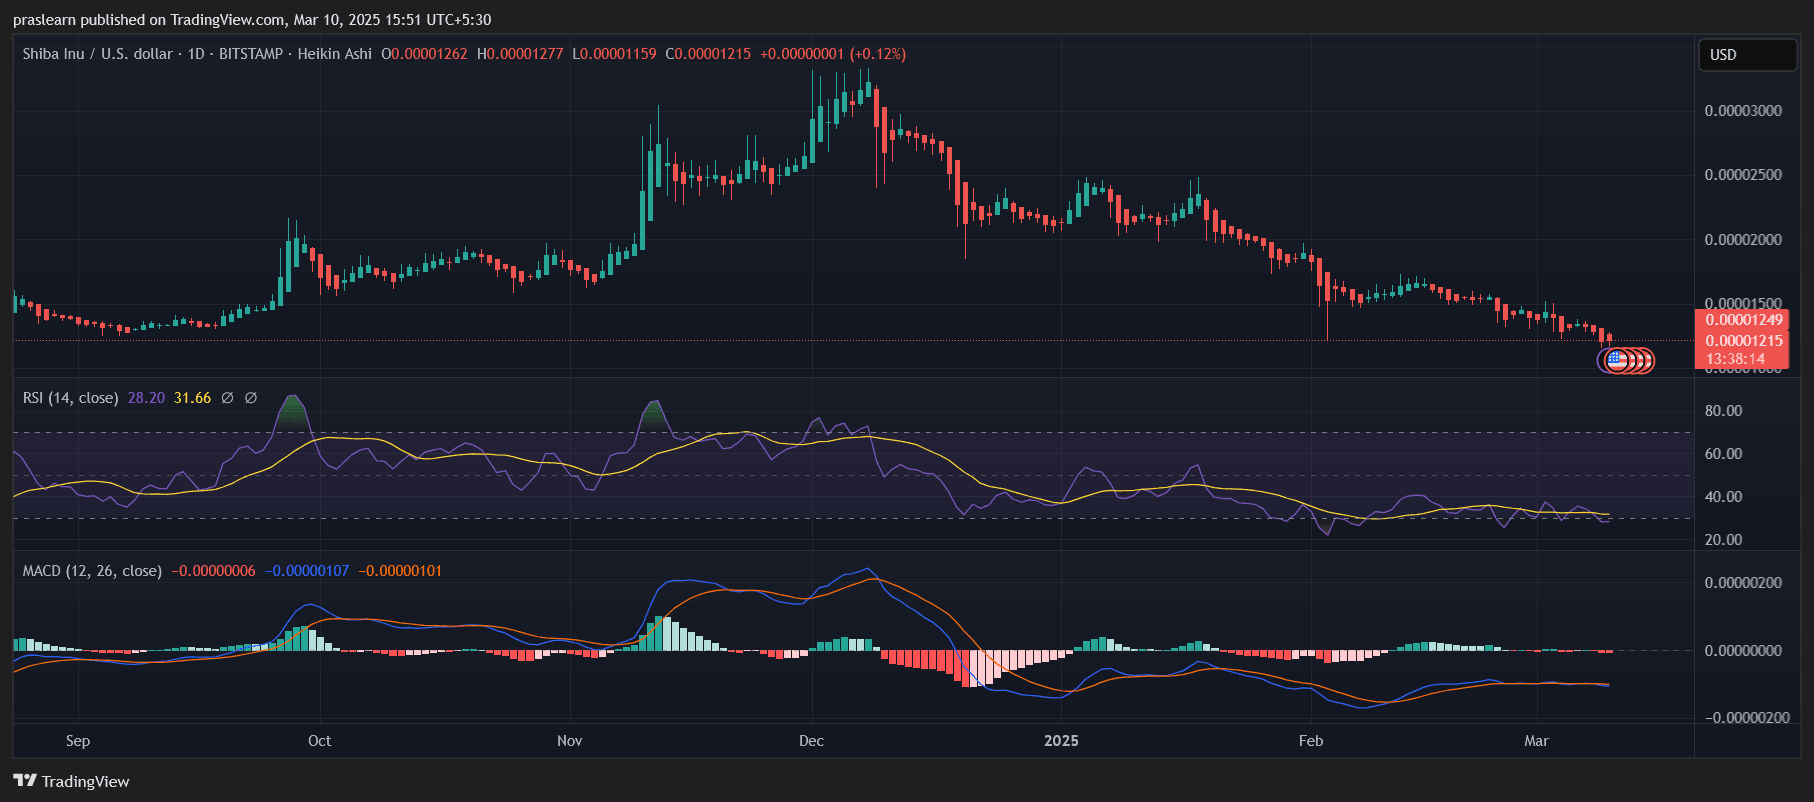
SHIB Price: Will Shiba Inu Price Crash to Zero?
4 reasons why Solana (SOL) price could rally back to $180

![]() VIPBitget VIP Weekly Research Insights
VIPBitget VIP Weekly Research Insights
Over the past few weeks, BTC has repeatedly tested the $100,000 resistance level, briefly breaking through multiple times before failing to hold, resulting in sharp declines Altcoins have entered a technical bear market, though SOL has shown resilience during both downturns and rebounds. However, the trading frenzy surrounding Solana-based memecoins has cooled, while discussions of institutional unlocking have gained traction on social media. On the night of March 2, Trump announced plans to establish a strategic crypto reserve, explicitly mentioning BTC, ETH, XRP, SOL, and ADA. This statement briefly reignited market sentiment amid oversold conditions, triggering a sharp crypto rebound. However, macroeconomic conditions remain largely unchanged, and liquidity recovery is a gradual process. The rally sparked by Trump's comments quickly faded, suggesting the market may still face further downsides. The following recommendations highlight projects worth monitoring in the current cycle, though they may not yet have reached an optimal entry point.

Texas Senate Passes Bitcoin Reserve Bill With 80% Votes in Favor
Texas' Bitcoin Reserve bill cleared the Senate with strong bipartisan support. Without mandatory Bitcoin purchases, it now moves to the House for a final vote.
